Panel Data Insights
The panel data insights feature leverages AI to analyze all data in the current panel, automatically generating a structured, easy-to-understand, and business-insightful analysis report. This helps users quickly grasp the core value of the data and lowers the threshold for interpretation.
Key Features
- Automatic Analysis: No need to manually organize data—AI automatically outputs analysis conclusions.
- Business Insights: Uncovers the potential value behind the data in the context of your business.
- Structured Reports: Clear and organized content, making it easy to understand and support further decision-making.
- Convenient Interaction: Supports one-click generation, regeneration, and closing for simple operation.
Use Cases
Ideal for scenarios where you need to quickly understand panel data, assist in decision-making, or report data conclusions to team members.
How to Use
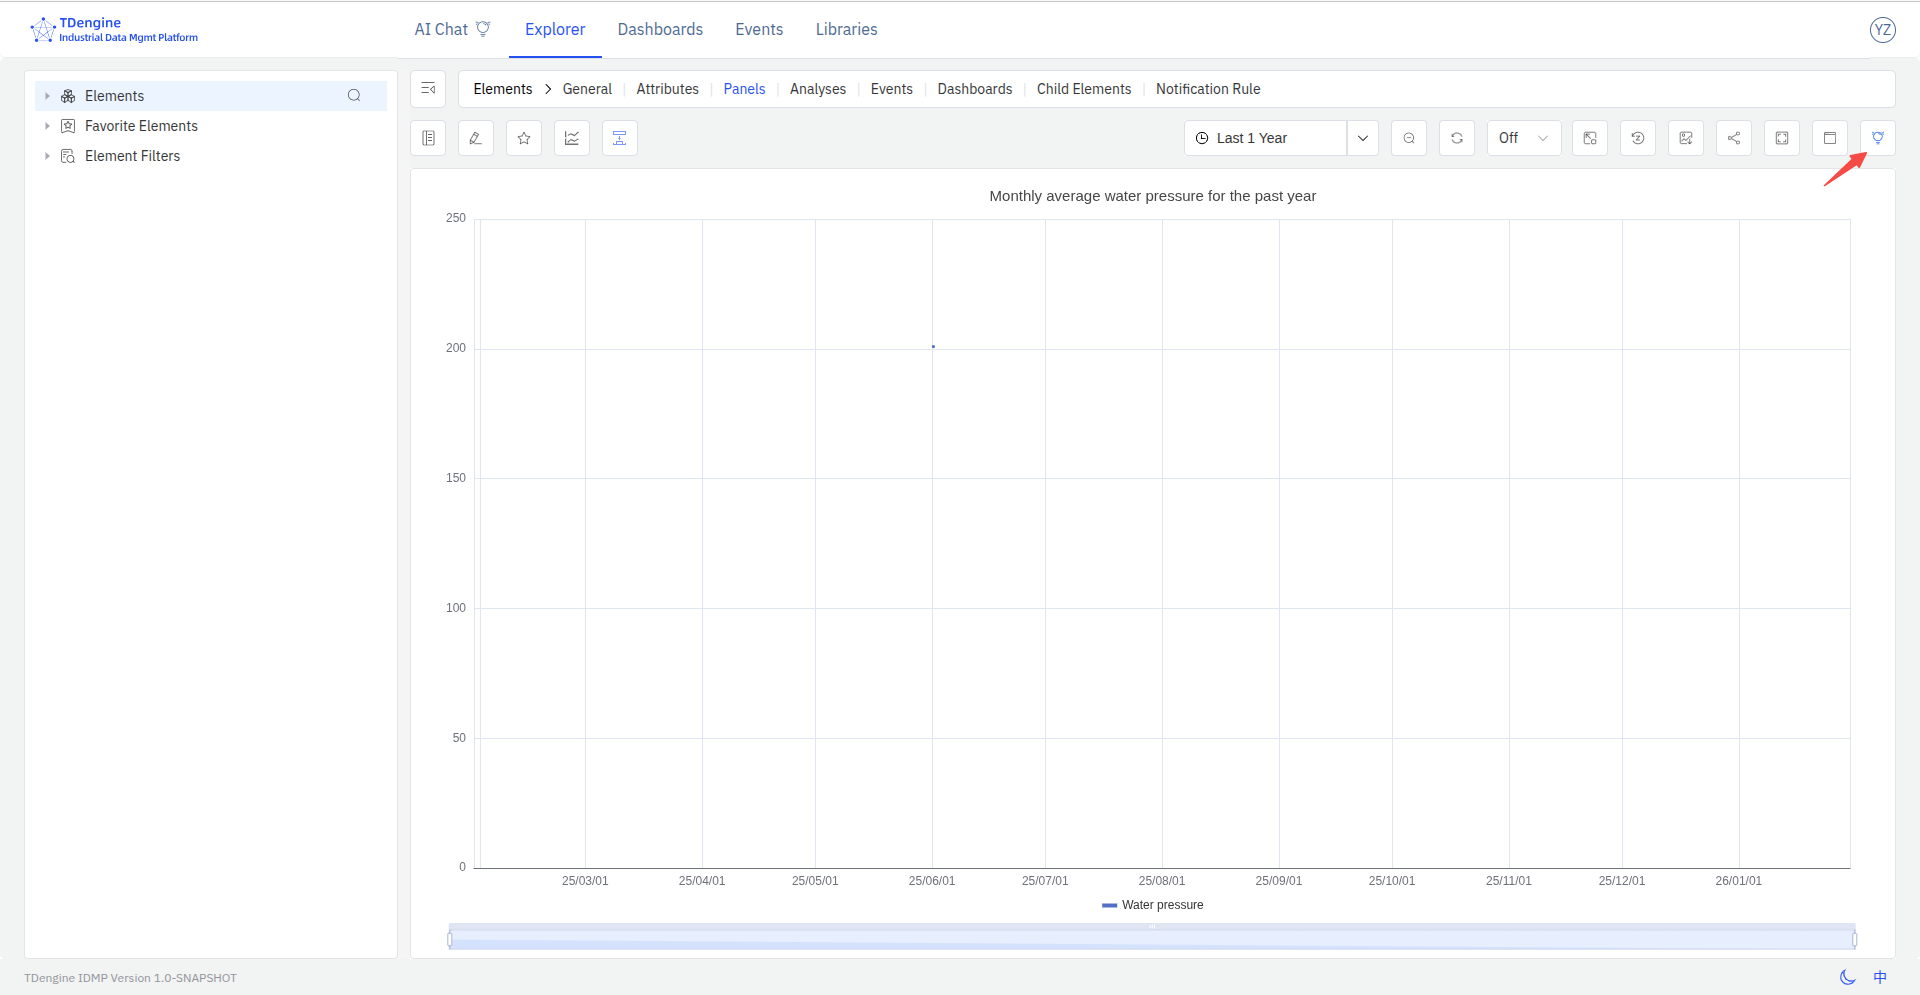
- On the panel view page, click the Panel Insights button in the upper right corner.
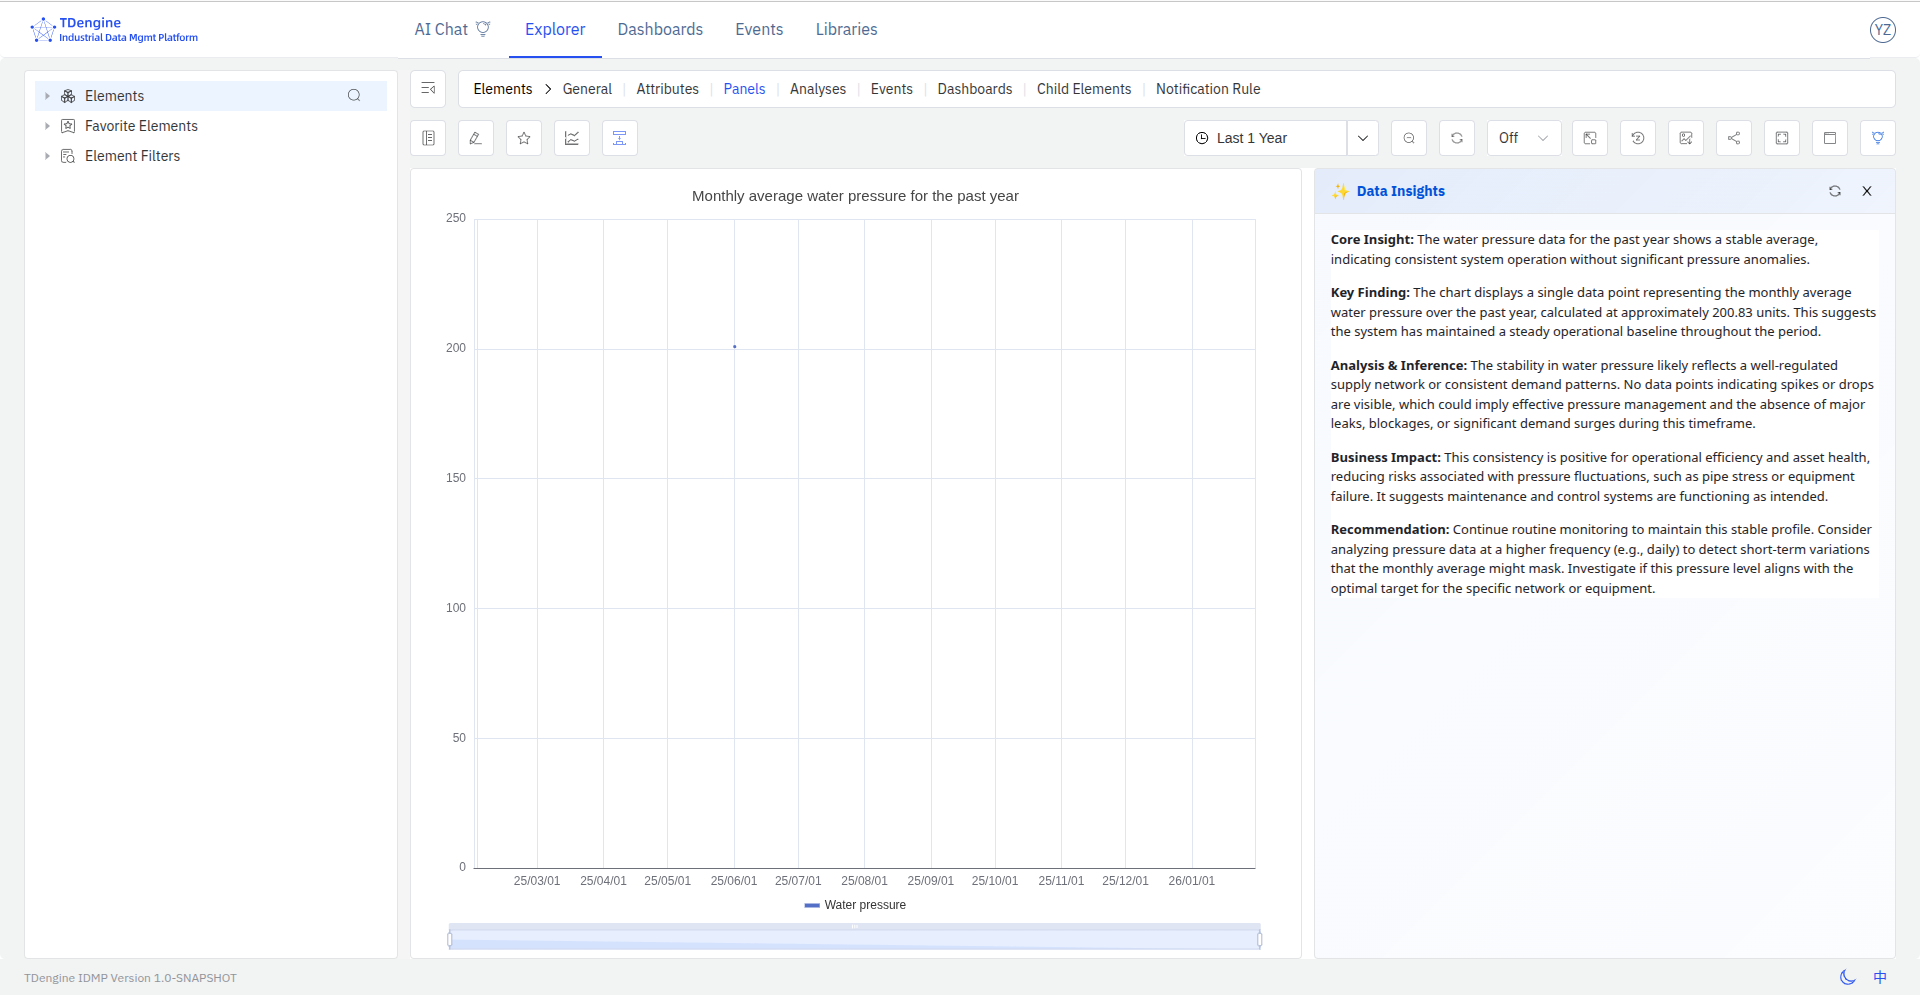
- The system will automatically open the data insights area and stream the AI analysis report.
- The generated analysis report will be displayed on the right side of the page, including data overview, trend analysis, anomaly detection, business recommendations, and more.
Regenerate Analysis Report
If you are not satisfied with the current analysis results or the data has changed, click the "Regenerate" button in the upper right of the data insights area. AI will regenerate the analysis report based on the latest data.
Close Data Insights
To hide the analysis report, click the "Close" button in the upper right of the data insights area to hide the data insights section.
Notes
- AI analysis results are for reference only. Please combine them with your actual business scenario for judgment.
- If the panel contains a large amount of data, the analysis process may take longer. Please be patient.
- If the report cannot be generated, please check whether the panel data is complete, or click Regenerate to retry.
