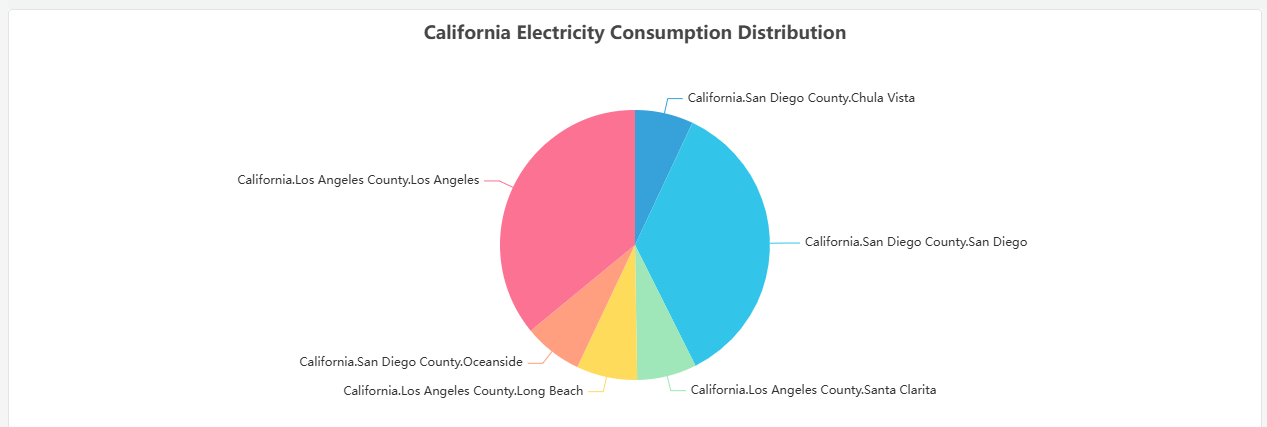
Pie
A pie chart is mainly used to show the proportion of data in different categories relative to the total, where each arc represents the proportion of the data quantity.
Roadmap
To continuously enhance your user experience, we will keep adding practical configurations in subsequent product updates, allowing you to enjoy richer and more user-friendly analysis features.
| Configuration | Description |
|---|---|
| Label Format | Currently, the labels only display aggregated category names. You can configure them to show richer content, such as values, proportions, and more. |
| Legend Placement | Set the position of the legend. |
| Pie Theme | You can configure richer styles, such as displaying it as a donut chart or a pie chart. |
